


Businesses across industries are focusing more and more on improving customer experience and building a loyal customer base. As a matter of fact, 96% of customers say customer service is important in their choice of loyalty to a brand(Source). Brands are constantly making changes to their customer journey maps in order to personalise communication and build better relationships with their customers. Sales and support teams play the biggest role in making this happen.
68% of customers say the service representative is key to a positive service experience. (Source)
To make sure that sales and support teams are continually improving and delivering stellar customer service, you need to monitor their performance. However, it can be easy to get overwhelmed by the sheer number of metrics that you can possibly measure. So, we’ve listed out the ones that are the most indicative of the performance of your customer-facing teams.
What are call centre metrics?
Call centre metrics are parameters that allow you to track your agents’ and call centre’s performance. The metrics can be calculated on an agent level, team level and even on a company level.
What are call centre KPIs?
As with any team, call centre agents have their own Key Performance Indicators (KPIs) which their managers use to measure their performance. This allows the teams to consistently improve their work, stay productive and deliver great customer service.
Few common call centre KPIs include first call response (FCR), average customer waiting time and abandon rate.
To help you stay in control and maintain quality of customer service we’re sharing 16+ call centre metrics that you should track on a regular basis. Let’s get started.
Inbound Call centre Metrics
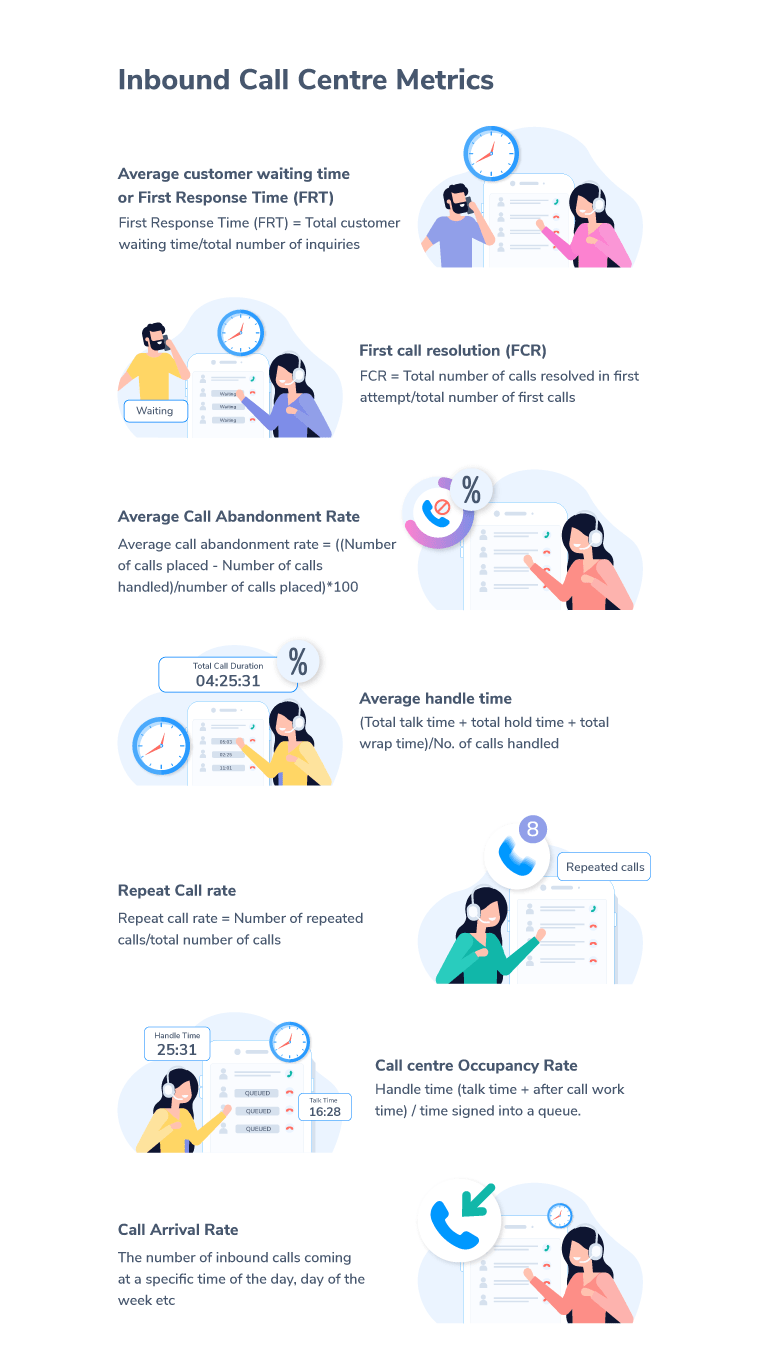
1. Average customer waiting time or First Response Time (FRT)
This is the average time a customer waits before getting connected to an agent. The lower the customer waiting time, the better. If your waiting time is significantly high it could result in increased customer drop-offs which in turn results in a bad customer experience (CX).
Here are a few things that can help reduce customer drop-offs-
-
- It’s always better to set the customer expectation right by telling them the average call waiting and alternative methods of reaching support.
- To keep callers engaged you can add a custom waiting tone that talks about the latest offers, common questions and more.
You can calculate your first response time using this formula –
First Response Time (FRT) = Total customer waiting time/total number of inquiries
With a cloud-based telephony solution, each agent is assigned a virtual number. When the agent places a call from his/her mobile phone, it is routed via this number and the call is tracked and recorded automatically. This gives your IT and operations leaders a clear view of everyday customer interaction. It also helps ensure SLA compliance, regular training, and effective management of remote agents.
2. First Call Resolution (FCR)
First call resolution is the measure of the number of customers who got their queries resolved in the first call vs the total number of customer calls made.
Resolving customers queries in the first call helps in two ways – first, it reduces the number of repeat calls and second, it results in higher customer satisfaction. This makes it a very important metric to track.
There are two ways to measure FCR –
FCR= Total number of calls resolved in first attempt/total number of calls received
Or
FCR= Total number of calls resolved in first attempt/total number of first calls
While it’s recommended to go with the first approach (gives an accurate picture), you can choose either to track FCR.
3. Average Call Abandonment Rate
If customers need to wait for long durations to connect with an agent, they end up abandoning calls. Average call abandonment rate measures the percentage of calls being abandoned. So, for example, you received 100 calls, out of which 10 calls were abandoned then the average call abandonment rate would be 10%. You can calculate the rate daily, weekly, or monthly.
Average call abandonment rate = ((Number of calls placed – Number of calls handled)/number of calls placed)*100
As a rule of thumb, to get an accurate measurement you can exclude the calls that were abandoned after a few seconds as these may be callers who might have dialled a wrong number.
One of the ways to decrease call abandonment is to train your agents to resolve queries faster and by providing them with the right tools that give caller’s contextual information like account details, past ticket history, and more.
4. Average handle time
This is the average time taken for a customer to get an issue “handled” or resolved, which includes hold time, transfers, and time spent talking to an agent, all the way to the time an agent spends after the call to resolve an issue. Here’s how to calculate it:
With cloud-based telephony, agents don’t need to access customer data at all. They can use Exotel’s virtual number to request a call to any customer that the system initiates and connects automatically.
(Total talk time + total hold time + total wrap time)/No. of calls handled
You can use this data to map the average handle time with the type of issue. This data can be especially beneficial for new agents to help them learn the benchmark. If your average handle time is substantially high, then you need to take a deeper look into the problem and check whether it’s because of your agents or the tools they use.
5. Repeat call rate
Often, customers’ issues are not solved in the first call and they need to call the helpline multiple times to get a resolution. Repeat call rate is the measure of such occurrences. By going through the ticket history of such cases, you can find the similarities in the issues that aren’t being resolved in the first attempt by the agents. Here’s how you can measure repeat call rate at your company –
Repeat call rate = Number of repeated calls/total number of calls
Few ways to reduce the repeat call rate are by transferring calls to the right agents, training agents for those issues and providing self-serve options to customers.
6. Call centre Occupancy Rate
This occupancy rate is the measure of the number of time agents spend on call vs the time they are free. Here’s how to calculate it:
Handle time (talk time + after call work time) / time signed into a queue.
For example, when an agent spends 80% of his work time speaking to customers then his occupancy rate is 80%. If your call centre occupancy rate is too low then it might be because of the following reasons –
- You’re aren’t receiving enough calls. This might be the result of multiple reasons including a holiday.
- Overstaffing
- Poor distribution of calls among agents
7. Call Arrival Rate
Call arrival rate helps you understand the number of inbound calls coming at a specific time of the day, day of the week etc. Monitoring this metric will help you –
- Schedule your staff accordingly
- Check whether your software/hardware has the capacity to handle the surge in traffic (no need to worry if you’re using a cloud communication platform)
- Plan for the future
Customer Satisfaction Metrics
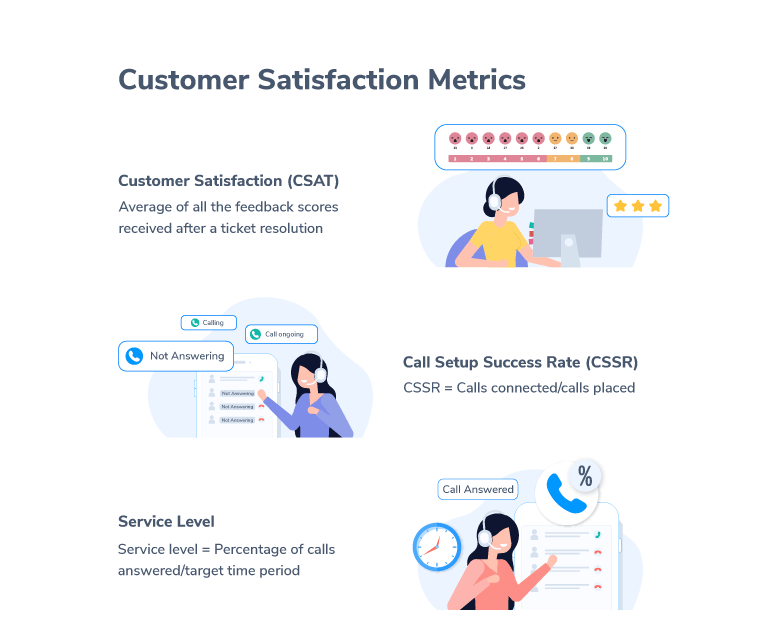
8. CSAT
Customer Satisfaction or CSAT is the measure of how satisfied customers are with a company’s products or services. It is a commonly used KPI to track your support team’s performance.
Here’s how it is measured –
After every ticket resolution, customers need to choose their overall satisfaction level by choosing the following options –
- Very unsatisfied
- Unsatisfied
- Neutral
- Satisfied
- Very satisfied
All the options have weightage from 1-5. All the feedback scores are averaged out to calculate the net CSAT score. In many cases, it’s converted into a percentage.
9. CSSR
Call Setup Success Rate or CSSR is the measure of the number of calls that get successfully connected. Remember, not all call attempts will be successful. Hence it’s important to monitor CSSR so that if you see a dip, appropriate actions can be taken.
Here’s how you can calculate CSSR –
CSSR = Calls connected/calls placed
10. Service Level
Call centre Service Level is the measure of the percentage of calls answered by a call centre team in a specific period. This period can range from 30 minutes, an hour to a week. You can measure this metric for an agent, a team or at a company level. You can calculate this using the following formulae –
Service level = Percentage of calls answered/target time period
So, for example, 80/60 seconds means that agents should be able to answer 80% of calls under 1 minute. This metric is directly tied to your call centre’s performance and customer service quality.
Outbound Call centre Metrics
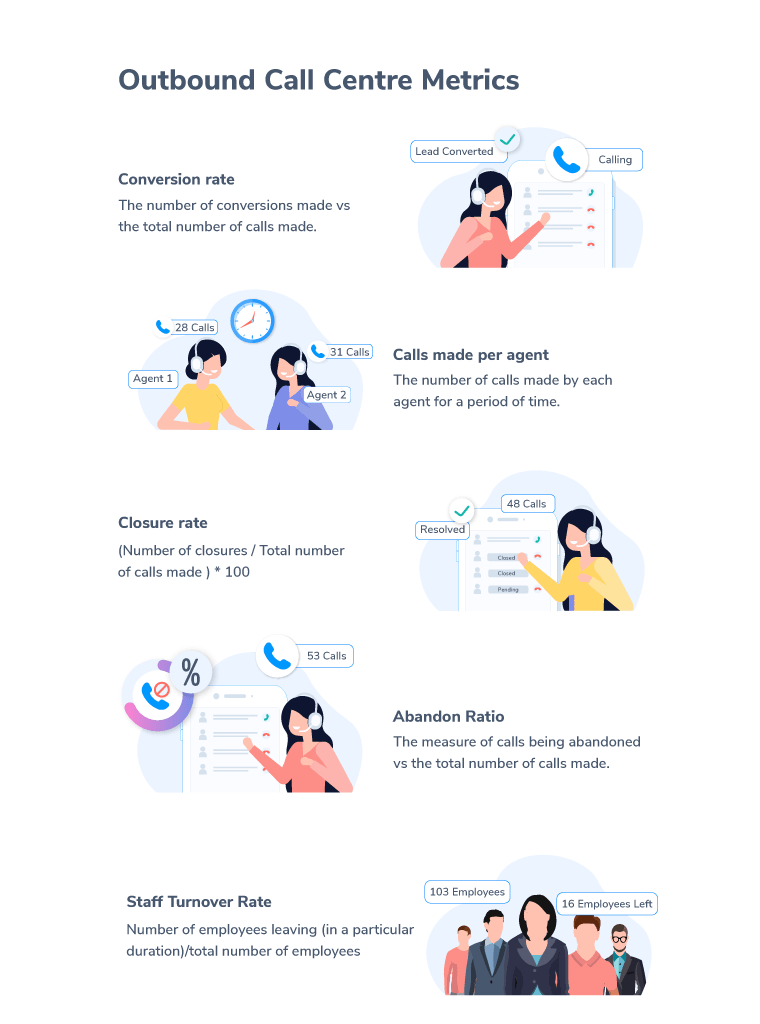
11. Conversion rate
As the name suggests, it is the number of conversions made vs the total number of calls made. For example, if you get 20 conversions after making 200 calls, your conversion rate would be 10%. Conversion rates help you understand the impact of your outbound calling efforts.
Conversions don’t always have to be tied with business revenue, for many companies it can be as simple as an appointment/demo booking.
12. Calls made per agent
This is the number of calls made by each agent for a period of time. If you’ve set specific daily or monthly goals, this metric will help you understand and compare the performance of your agents.
13. Closure rate
A closure is when you successfully close a deal with a customer – that is, when they convert and buy your product/services. You can calculate this metric by dividing the number of closures by the total number of calls made.
( Number of closures / Total number of calls made ) * 100
For example, if your team made 10 closures out of 100 calls, the closure rate would be 10%.
14. Abandon ratio
Usually, large call centre teams use dialers to call a list of leads. This saves them time from manual dialing and prevents any error because of entering numbers manually. This is done using a dialer. Few popular ones are auto-dialer, predictive dialer and a progressive dialer.
To ensure agents make the best use of their time, a predictive dialer already dials a number from the list and keeps the user on hold. Agents can connect with the user once they’ve completed the last call. While a predictive dialer saves more time compared to any other dialer, keeping customers on hold also means that they can abandon the call before connecting with an agent.
Abandon ratio is the measure of calls being abandoned vs the total number of calls made. Tweaking the settings of a predictive dialer can greatly help reduce this number.
15. Staff Turnover Rate
If you run a large call centre, then you must already know how common it is to have agents leaving every month. Employees leaving is a huge issue as you need to find a replacement, onboard and train them. This takes away additional resources and that’s the reason you should try keeping this number low.
To keep a track of this you need to measure how many agents are leaving, or the staff turnover rate. Here’s how you can calculate it –
Number of employees leaving (in a particular duration)/total number of employees
While it’s natural for some employees to leave your company, if the staff turnover rate is significantly higher (let’s say above 25%) you should check whether –
- You’re paying competitive salaries
- If agents are overworked or bored. Consider checking your occupancy rate.
- Managers are managing teams well
Over to you
This list is in no way exhaustive but should help you get started. To grow in today’s environment, businesses need to keep improving their processes constantly. For that to happen, measuring these metrics is imperative. A lot of these metrics often get automatically tracked inside your call centre software. However, you may have to tweak certain settings or create additional workflows to track the rest.
Just ensure that in addition to tracking these metrics, you also block time to analyse the data and take steps accordingly.